Abstract
Analog camera shutter speeds can vary significantly from their expected values. These deviations are caused by factors such as imprecise manufacturing, component wear, environmental conditions, shutter trigger method, and contaminant ingress. Obtaining accurate shutter speed values is important in both photography (when adjusting shutter speed to match a target exposure value) and photometry (when measuring total exposure).
I endeavored to develop a process for calibrating shutter speed in analog cameras using inexpensive, readily-available components. In order to produce calibration data, I constructed a simple circuit for measuring photographic exposure time. The shutter for the device under test was then triggered multiple times at each setting, allowing light to strike the sensor. The true exposure time was recorded for each trial. Both manual and self-timer triggers were tested. The observed exposure times for each setting were compared against their expected values to generate a calibration table.
I applied this process to a sample device, a Kodak No. 2 Supermatic large format shutter of unknown manufacture date, and constructed an associated calibration table. I found that for some settings, the true exposure time deviated by up to 2 stops from the expected value.
Though this technique is not strictly novel1 2 3, I present it here in the hope that it proves useful to others.
Process
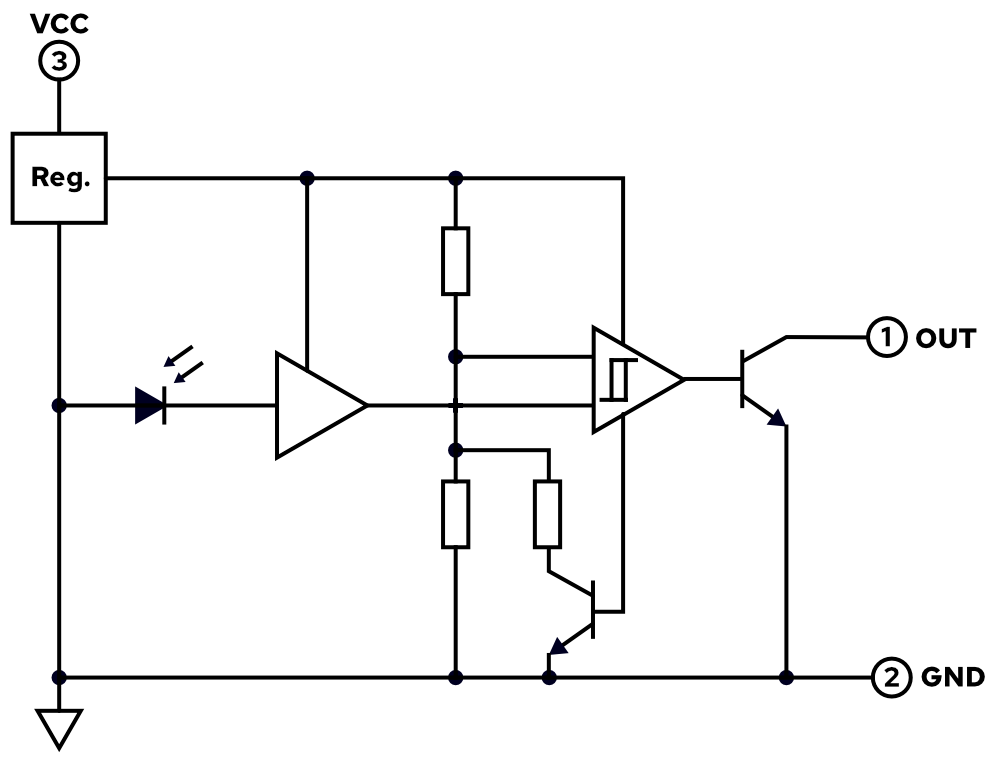
A simple circuit was constructed to detect light using an optoelectronic switch, visible in Figure 1. This circuit was powered using a 3.3v linear regulator supplied via a standard USB port. A white LED of sufficient brightness to trigger the sensor was also connected to the power supply. The output was connected to a Saleae Logic digital logic analyzer for measurement.
The device under test was located such that it selectively interrupted the path between the LED and the optoelectric switch.
Various settings were configured on the device under test (as described in Table 1) and the shutter was triggered multiple times per configuration. Both manual and self-timer trigger modes were tested. Data was captured using the attached logic analyzer, and interpreted using a custom measurement plugin (available in Appendix C).
The authors would like to note that a digital logic analyzer is not necessary for capturing data from this type of circuit; an analog oscilloscope is sufficient, as is a computer or smartphone audio connected via a decoupling capacitor.

Results
At all shutter speed settings, the actual exposure time was greater than expected, potentially producing overexposed images. The error generally increased in magnitude as the speed setting increased, indicating that the shutter performs closer to the marked values at slower speeds. At the upper end, the measured value deviated by nearly 2 stops; the device under test did not exceed a speed of about 1/100 s.
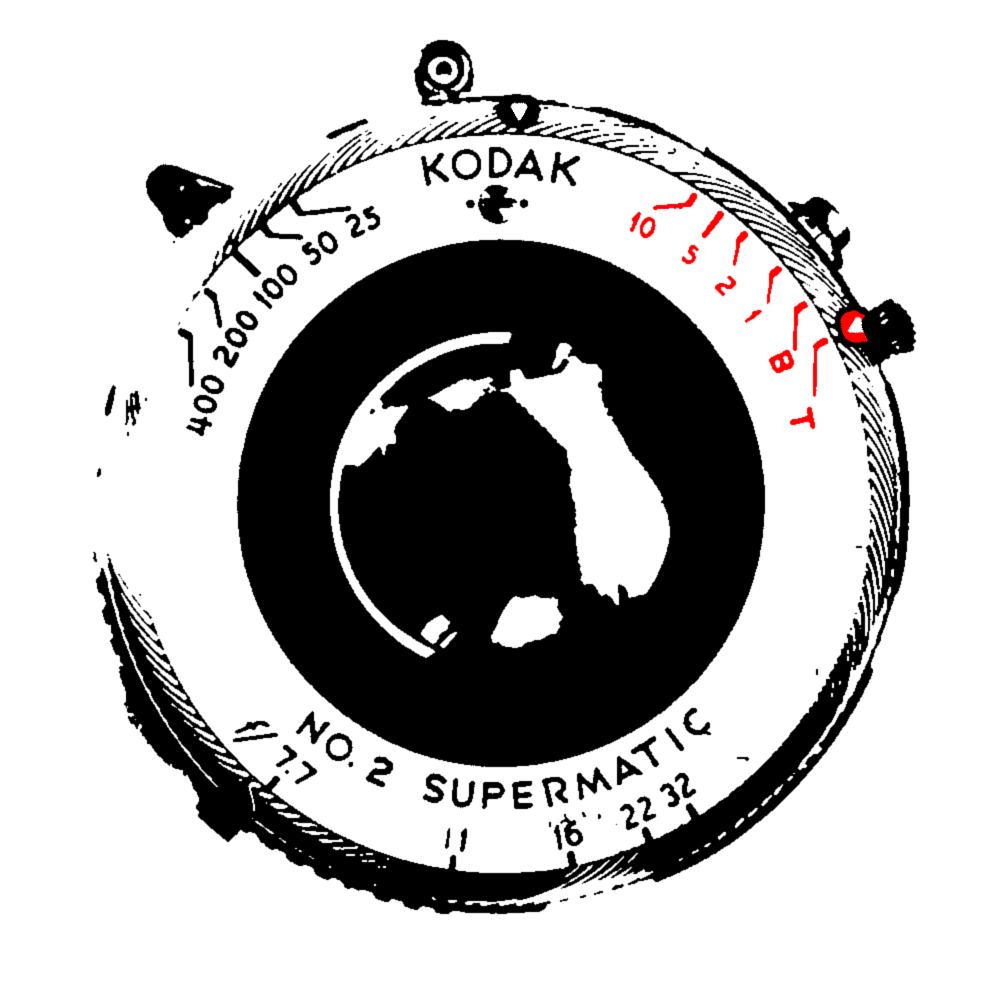
Note the discontinuity in error magnitude between the 10 and 25 settings; this corresponds with the physical discontinuity on the shutter dial, visible in Figure B1.
No significant differences could be seen between the manual and self-timer trigger modes, displayed in Table 2.
The 25 (timer) setting exhibited a noticeably higher range and coefficient of variation; I was unable to determine a possible cause.
Potential sources of measurement error include: delays introduced by the optoelectronic switch, imprecise dial setting selection, and bandwidth limits in the logic analyzer. It is the belief of the authors that none of these factors contributed significantly to the results presented.
Note: This table is applicable only to the specific device under test. it should not be relied upon for calibrating other shutters, even of the same model.
Setting
Mean Fraction
(1/s)Mean Error
(stops)Range
(stops)Min
(s)Mean
(s)Max
(s)Coefficient
of VariationN
1 (manual)
0.83
+0.267
±0.027
1.180E+00
1.203E+00
1.225E+00
1.080%
9
1 (timer)
0.83
+0.277
±0.034
1.182E+00
1.212E+00
1.239E+00
1.432%
7
2 (manual)
1.67
+0.258
±0.025
5.849E-01
5.979E-01
6.056E-01
1.013%
9
2 (timer)
1.73
+0.205
±0.033
5.622E-01
5.764E-01
5.885E-01
1.510%
7
5 (manual)
3.66
+0.451
±0.080
2.633E-01
2.735E-01
2.944E-01
3.591%
10
5 (timer)
3.66
+0.451
±0.039
2.652E-01
2.734E-01
2.800E-01
2.107%
7
10 (manual)
5.32
+0.910
±0.068
1.821E-01
1.880E-01
2.001E-01
3.199%
10
10 (timer)
5.33
+0.907
±0.034
1.828E-01
1.875E-01
1.915E-01
1.599%
8
25 (manual)
19.61
+0.351
±0.039
4.971E-02
5.100E-02
5.245E-02
1.790%
10
25 (timer)
18.83
+0.409
±0.157
5.034E-02
5.311E-02
6.262E-02
8.146%
7
50 (manual)
30.17
+0.729
±0.054
3.179E-02
3.314E-02
3.428E-02
1.998%
10
50 (timer)
29.92
+0.741
±0.036
3.245E-02
3.343E-02
3.410E-02
1.740%
7
100 (manual)
51.84
+0.948
±0.035
1.884E-02
1.929E-02
1.977E-02
1.273%
10
100 (timer)
52.74
+0.923
±0.043
1.823E-02
1.896E-02
1.936E-02
2.256%
7
200 (manual)
94.10
+1.088
±0.060
1.025E-02
1.063E-02
1.113E-02
2.793%
10
200 (timer)
93.19
+1.102
±0.035
1.038E-02
1.073E-02
1.089E-02
1.615%
8
400 (manual)
102.88
+1.959
±0.055
9.206E-03
9.720E-03
9.941E-03
2.224%
10
400 (timer)
102.41
+1.966
±0.062
9.504E-03
9.765E-03
1.035E-02
2.758%
8
Setting
Mean Difference
(s)Error Difference
(stops)
1
8.651E-03
0.010
2
2.148E-02
0.053
5
7.764E-05
0.000
10
4.889E-04
0.004
25
2.110E-03
0.058
50
2.819E-04
0.012
100
3.284E-04
0.025
200
1.039E-04
0.014
400
4.529E-05
0.007
Appendix A: NTE3039 Optoelectronic Switch
Very little information is available online about the NTE3039 Optoelectronic Switch. Unfortunately, the datasheet provided on NTE’s website is incorrect and describes a different component. Figure A1 reproduces the equivalent circuit diagram for the ECG3039 Optoelectronic Switch as described in the ECG Semiconductors Master Replacement Guide4. As NTE advertises the NTE3039 as a replacement part for the ECG3039, the authors believe that the two components likely have similar equivalent circuit diagrams.
Appendix B: Kodak No. 2 Supermatic Shutter
Figure B1 illustrates the device under test, a Kodak No. 2 Supermatic large format shutter. Shutter speed markings are present on the upper edge of the dial. To alter the speed, the dial is rotated until the desired speed aligns with one of two indicators. Of note is the discontinuous shutter speed markings: the groupings 400-200-100-50-25 and 10-5-2-1 are located on different parts of the dial, and are selected using different
Appendix C: Source Code
- Interval Pulse Stats v0.0.1 : Saleae Logic 2 plugin used for measuring exposure times captured from sensor circuit.